
Met Office graphic decadal-forecast-2019-2023
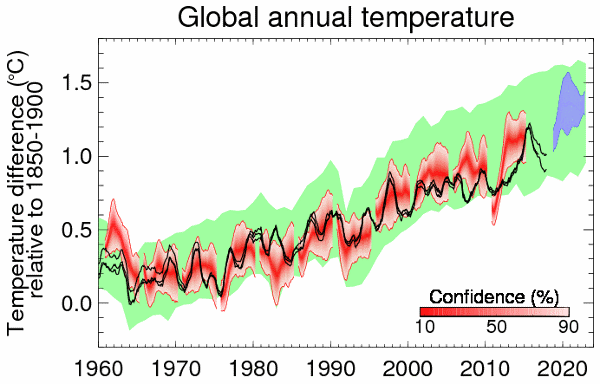
Met Office graph indicates the likely range of temperatures for the period 2019 to 2023. The black line represents the observations and the red area indicates previous forecasts.
Met Office graph indicates the likely range of temperatures for the period 2019 to 2023. The black line represents the observations and the red area indicates previous forecasts.